How Can beer brewing equipment Improve Production Efficiency?
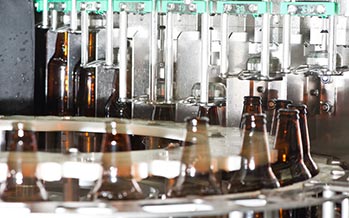
Beer brewing equipment improves production efficiency by shortening batch cycles, raising extract recovery, reducing water and energy use, limiting manual work, and increasing tank utilization. A well-sized brewhouse can coordinate mashing, lautering, boiling, whirlpooling, and wort cooling with fewer delays, while automated temperature, flow, and CIP controls improve repeatability. Brewery benchmarking also shows why measurement matters: the Brewers Association uses indicators such as water, electricity, natural gas, solid waste, and CO₂ consumption to compare brewery performance. In one published case, Bell’s Brewery reduced tank-cleaning water consumption by about 65% after changing its CIP system.
A brewery usually loses production time at process transitions rather than during the actual recipe steps. If a 20 hL brewhouse takes 5 hours from mash-in to cooled wort, cutting the cycle to 4.25 hours creates 0.75 additional production hours per turn. Across 4 turns per day and 250 production days, that represents 750 hours of annual schedule capacity, assuming downstream tanks and packaging can accept the additional output.
Equipment capacity should be measured as completed production per hour, not only vessel volume.
A multi-vessel brewhouse can overlap operations that would otherwise be sequential. While one batch is boiling for 60–90 minutes, the next batch can begin mashing or lautering. A mash tun, lauter tun, kettle, and whirlpool arranged around the same transfer system can therefore support more turns without increasing the nominal batch size. The gain depends on pipe diameter, pump flow, heating rate, vessel recovery time, and operator procedures, so a 20 hL brewhouse with a 40-minute transfer bottleneck may produce less beer per shift than a smaller system with faster transfers.
The mash and lauter section affects both time and raw-material use. If extract efficiency increases from 72% to 78%, the brewery recovers 6 additional percentage points from the same malt bill. The Brewers Association reported in 2026 that a 10% increase in extract efficiency can reduce malt required per batch by approximately one bag in some production settings.
Temperature stability also reduces rework. A mash controlled within approximately ±1°C of the programmed rest temperature is easier to reproduce than one adjusted manually every 10–15 minutes. Automated probes connected to PLC controls can regulate steam, electric heating, pumps, and agitators according to a recipe, reducing repeated valve changes and manual temperature corrections during 8-hour production shifts.
Once wort leaves the kettle, cooling speed becomes another measurable production variable. A plate heat exchanger sized for the target wort flow can reduce the time required to move a full batch into fermentation. If 2,000 L of wort is cooled at 4,000 L/h, the theoretical transfer time is about 30 minutes; at 2,500 L/h, the same volume requires 48 minutes before accounting for line losses and operating interruptions.
A heat exchanger that saves 18 minutes per batch can save 72 minutes across four daily brewhouse turns.
Heat recovery adds another efficiency gain. During wort cooling, heated process water can be collected in a hot-liquor tank instead of being discharged. A published Brewers Association case study reported that Long Trail Brewing recovered about 3.7 million BTUs per day from steam condensate for subsequent brewing-related use. Another case at Bear Republic captured chilled-water heat and avoided about 7,500 gallons of potable water entering wastewater each week.
Water consumption deserves separate measurement because brewing uses water in mashing, sparging, cooling, CIP, packaging, and general cleaning. Historical brewery studies have documented several cubic meters of water use for each cubic meter of beer depending on process configuration, while newer benchmarking programs encourage breweries to measure their own normalized water intensity rather than rely on a single industry average.
Automated CIP systems can control rinse duration, chemical concentration, temperature, and circulation time with greater consistency than manual operation. Bell’s Brewery reported about a 65% reduction in tank-cleaning water after changing its cleaning procedure, while its filling operation reduced drain flow from 56.8 L/min to 7.6 L/min, generating an estimated annual saving of more than 9 million liters of water.
The same equipment approach applies to chemical and labor use. A CIP skid with fixed programs can run a 45-minute alkaline wash, controlled rinse, and sanitizing stage according to validated parameters, whereas manual cleaning may involve repeated checks and adjustments. Saving even 20 minutes per tank across 8 tanks per production day produces 160 minutes of recovered labor time.
Cleaning efficiency should reduce time and resource use while maintaining the required sanitation standard.
Pumps influence efficiency through both flow rate and control. A variable-frequency drive can adjust pump speed for mash recirculation, wort transfer, CIP circulation, or tank transfer instead of operating at one fixed speed. Running a pump at 70% speed is not equivalent to using 70% of rated electrical energy in every application, but reduced flow demand can lower power consumption substantially under suitable system conditions because centrifugal-pump power changes strongly with operating point.
Pipe design matters as well. Excessively small lines increase pressure losses and may restrict the flow available to the heat exchanger or fermentation vessels. A brewery that needs 5,000 L/h but operates through a line arrangement capable of only 3,000–3,500 L/h may spend more time on every transfer, even when the brewing vessels themselves have enough capacity.
Fermentation equipment can also determine whether brewhouse improvements produce usable additional output. If a brewery adds a 25% faster brewhouse but fermentation tanks remain occupied for 14 days, additional wort may simply wait for tank space. Unitanks that support fermentation, conditioning, carbonation, and beer transfer in one vessel can reduce the number of intermediate movements required for selected beer styles.
Tank utilization can be measured with occupancy data. A 40 hL fermenter occupied for 12 days provides fewer annual production cycles than the same vessel occupied for 9 days. Reducing average residence time from 12 to 9 days would increase the theoretical number of annual cycles by 33.3%, assuming recipe requirements and quality specifications allow the shorter schedule.
Packaging often sets the final production rate. A brewhouse producing 100 hL per day does not create 100 hL of packaged beer if the filler handles only 60 hL per day. Equipment planning therefore needs a simple capacity table:
| Process | Example capacity | Main efficiency metric |
|---|---|---|
| Brewhouse | 20 hL/batch | hL per shift |
| Wort cooling | 4,000 L/h | Transfer minutes/batch |
| Fermentation | 40 hL/tank | Tank days/cycle |
| CIP | 45 min/circuit | Water + chemical/L |
| Packaging | 60 hL/day | Packaged hL/day |
Energy measurement should use output-adjusted figures. The Brewers Association's five-year benchmarking report compared electricity, water, natural gas, solid waste, and purchased CO₂ across participating breweries and production-size groups; one electricity example showed a median of 140 kWh per barrel among 20 breweries in the displayed sample.
Insulation, heating-system efficiency, VFD-controlled motors, refrigeration performance, and heat recovery can all change the energy required per unit of beer. A brewery using 100,000 kWh to produce 5,000 hL consumes 20 kWh/hL; if output reaches 6,000 hL with the same annual electricity use, the intensity falls to 16.7 kWh/hL, a reduction of about 16.5%.
Data collection makes equipment improvements easier to verify. The Brewers Association's benchmarking resources are designed to help breweries measure resource use and compare performance over time, while EPA guidance recommends establishing a baseline from utility and equipment data before evaluating efficiency improvements.
A practical brewery dashboard can therefore track:
-
batch cycle time in minutes
-
extract efficiency in %
-
wort cooling time per batch
-
water use per hL
-
electricity use per hL
-
natural gas or steam use per hL
-
CIP minutes and liters per cycle
-
fermentation days per batch
-
packaged beer yield %
-
labor hours per batch
For breweries comparing suppliers, equipment specifications should be checked against the intended production schedule rather than vessel volume alone. hgmc brewing equipment, for example, can be evaluated around brewhouse configuration, fermentation capacity, heating method, cooling arrangement, CIP design, automation, tank dimensions, and utility requirements instead of considering the advertised tank size in isolation.
A 2026 installation plan should also allow room for future tanks, larger glycol demand, additional electrical circuits, expanded hot-water storage, and control-system I/O. Adding 10 fermenters later is much easier when the original utility system has spare capacity and the pipe layout was designed for expansion, rather than requiring major reconstruction after production has already increased.
The result of equipment planning can be measured in operational figures: a shorter 5-hour batch may become a 4-hour batch; a 72% extract yield may become 78%; a 65-minute manual CIP process may become 45 minutes; and water use may fall from 6 L/L of beer to a lower site-specific figure. Each improvement should be confirmed through production records over at least several weeks or multiple batches rather than estimated from equipment brochures alone.